 Have you ever wanted to have each of your survey participants rank 5 product reviews from a set of thousands, or gather comments on a handful of images from a set of hundreds? Maybe you want to show users a response they provided in a previous survey. Well, now you can with the Dynamic Item Server (DYIS) developed by the Research Programming Team. Just email us to get started.
How It Works
The application is self-serve and all you need to get started is a CSV with header rows that include columns app_id, served and order.
app_idA name for the set of items. We call this an App.servedThis is the initial served count and will almost always be set to 0.orderThis will be a number and will be used as the ordering when serving items. See the Orderings Options section for more details.
All other columns will be delivered as the key/value payload for the item. You can now add a Qualtrics Web Service call in your survey flow to request a set of n items. As items are served, their served count will be incremented and new items will be ordered first by their served count and then by their order value. The result is that all items will be served once evenly before cycling though the items again.
Orderings Options
When creating a new App you can choose from the following ordering methods.
Nonewill serve items in a cycle using your providedorderingvalue, in ascending order, repeatedly.On Next Cyclewill serve items using your providedorderingvalue in ascending order for the first cycle, but be randomized for each subsequent cycle.By Keywill serve items using your providedkeyvalue, cycling as if you selectedOn Next Cycleordering. You can learn more about using keys here.
Examples
With the following CSV:
| app_id | order | served | color |
| testing | 1 | 0 | red |
| testing | 2 | 0 | green |
| testing | 3 | 0 | blue |
| testing | 4 | 0 | cyan |
| testing | 5 | 0 | magenta |
| testing | 6 | 0 | yellow |
| testing | 7 | 0 | orange |
| testing | 8 | 0 | white |
| testing | 9 | 0 | black |
| testing | 10 | 0 | grey |
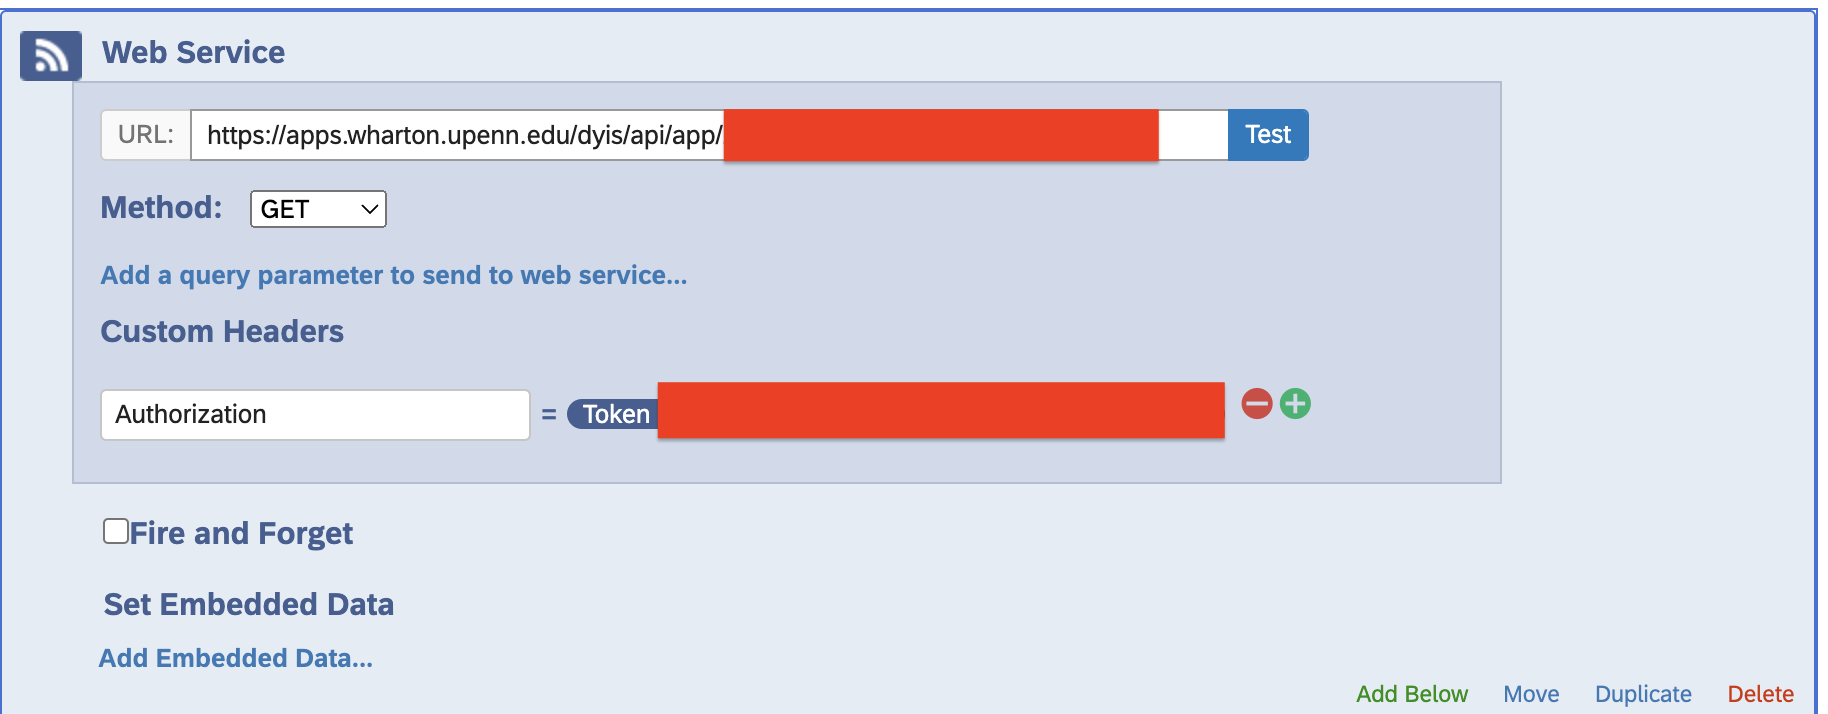
After uploading this CSV with the ordering method set to “On Next Cycle”, follow the instruction on the DYIS’s app to add the web service call to your Qualtrics survey. Assuming you want to show 2 colors to each participant, your first 10 survey participants will receive the following colors:
- red, green
- blue, cyan
- magenta, yellow
- orange, white
- black, gray
- cyan, green
- green, black
- red, yellow
- orange, white
- blue, magenta
Since the ordering method is set to “On Next Cycle”, the first cycle order (participants 1-5) is determined by the user supplied ordering value but each subsequent cycle will be randomized. Note that participants 6-10 received the full set of colors, but with new ordering and pairing. This is helpful if you want to make sure that items are not served with the same set of other items across all cycles.
What About Keys
Assume you wanted to show users their favorite color they selected in a previous study. You can do that using the “By Key” ordering method.
Assuming you have following CSV
| app_id | order | served | color | key |
| testing_with_keys | 1 | 0 | red | user1 |
| testing_with_keys | 2 | 0 | blue | user2 |
| testing_with_keys | 3 | 0 | yellow | user3 |
| testing_with_keys | 4 | 0 | white | user4 |
and the ordering is set to “By Key”. And assuming you have the user’s ID somewhere in the survey, you can now use Qualtrics’s Piped Text feature to provide the user ID to the web service call for a single item. If the key matches an item in the set, it will return that item’s payload. So if the request calls for 1 item with “user2” as the key, “blue” would be returned and its served count would be incremented.
How To Get Started
We hope that you will find new uses for this service and we are happy to work with you on implementation, testing and delivery. Just shoot us an email at research-programming@wharton.upenn.edu to get started.


